American Inequality

Share this post
Police killings and Inequality
americaninequality.substack.com

Police killings and Inequality

30 years after Rodney King, police kill a Black person every 40 hours in America, and police are the 6th leading cause of death for young Black men.

Jeremy Ney
Jun 22
2
1
Share this post
Police killings and Inequality
americaninequality.substack.com

Interactive data viz

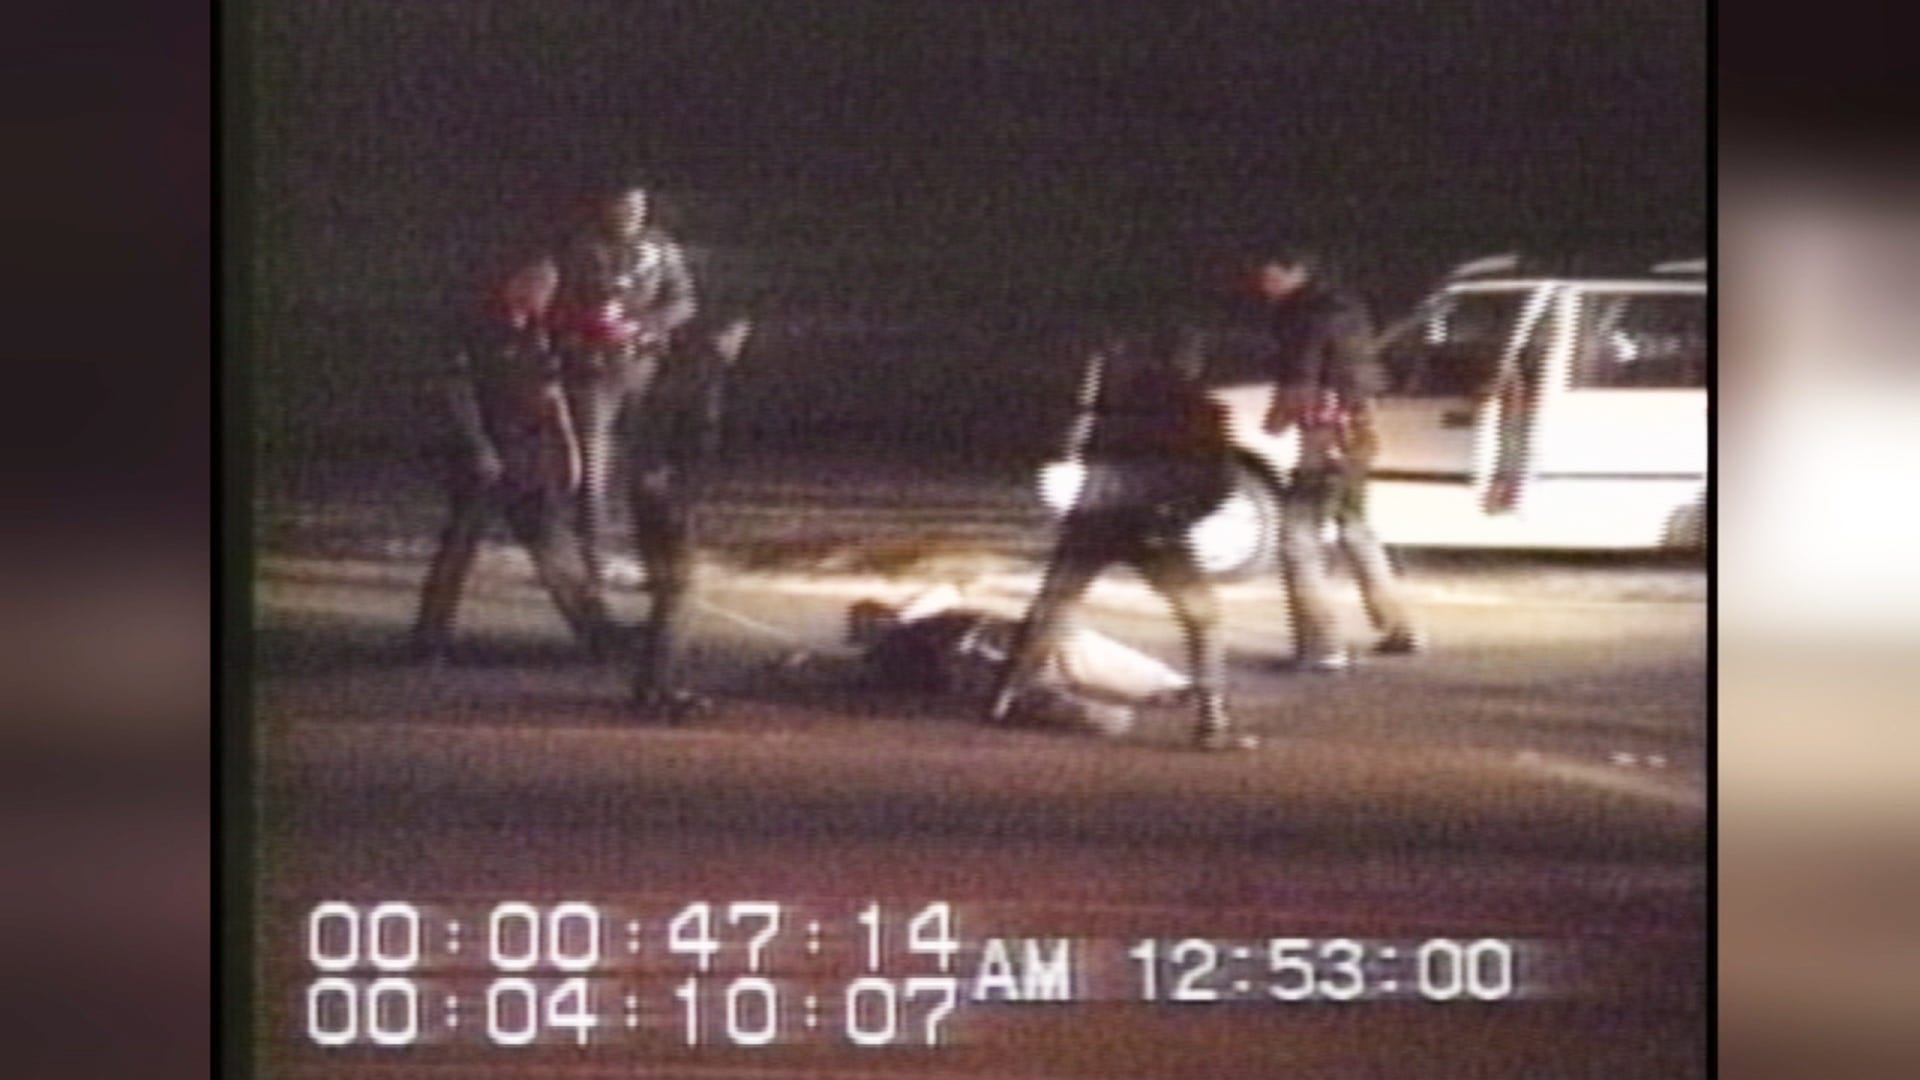
Police beat Rodney King to within an inch of his life on the side of the road in 1991. King was unarmed, but police broke his leg, smashed his face, and burned his body with a taser. George Holliday filmed the entire event from a nearby balcony. When all four officers were acquitted, Los Angeles broke into the 1992 riots that lasted six days and killed 63 people, with 2,383 more injured. The riots only ended after the California Army National Guard, the Army, and Marine Corps provided reinforcements to re-establish control in the city. 

Exactly 30 years after the LA riots, we look at data on continued police violence in America. 

  • Black people are killed every 40 hours by police. 

  • Police are the 6th leading cause of death for young Black men in America. 

📍Location is a huge predictor of how likely police killings are to occur. Black Chicagoans, for example, are 650% more likely to be killed by police than white Chicagoans.

After the police beat Rodney King, LA launched one of the largest riots in American history. 30 years later, police violence remains high.

+7,500 shot and killed in the last 7 years

In the previous 7 years, police have shot and killed 7,500 people in America, 1 in 10 of whom were unarmed or carrying a non-harmful object. This doesn’t even include the thousands of people that police have killed in chokeholds, with tasers, with beatings, and in custody - data that is much harder to gather. 

🚨 Data on police violence shows that you’re about two to three times more likely to face deadly force if you’re Black than if you’re White. 🚨

American Inequality is a reader-supported publication. To receive new posts and support my work, consider becoming a free or paid subscriber.

However, data on police violence may be dramatically underreported. Researchers estimate that the US National Vital Statistics System (NVSS), the government system that collates all death certificates in the USA, failed to accurately classify and report more than 17,000 deaths as being caused by police violence during the period from 1980-2020. This is based on government data compared against three open source databases: Fatal Encounters, Mapping Police Violence, and The Counted.

Interactive data viz

Unarmed and Black

Police shot and killed 305 unarmed Black men in America over the last 7 years. More than 100 of those killings occurred in just 3 states - California, Texas, and Georgia. Police also killed Americans carrying benign objects like “binoculars”, “toy weapons”, “batons”, and “bottles.” 1 in 3 were “not fleeing” and were still gunned down.

🤳 Moreover, 80% of these killings were conducted by police who were not wearing body cams.

Only 10 unarmed Black women were killed over this same time period, showing that men are at far higher risk of such violence. 

Interactive data viz

Police kill the greatest number of Black people relative to the state’s Black population in Utah and Rhode Island. Black people make up just 1% of Utah’s population but they represent 10% of police killings. This represents an overall trend in America. Police shoot and kill more Black people in states where Black people make up just 1-5% of the population, much lower than the national average of 12% Black. 

🚔 Much research has been done on the criminalization of Black men in America and lack of exposure to Black communities may drive up fear among other racial groups. While one Black death in a state with few Black people will have an outsize impact on metrics, it is also important to recognize the outsize impact that one death has in any community. In Mississippi, where Black people are 41% of the population (the highest in America), police shootings of Black people  almost exactly track the overall Black population. 

📊 The chart above illustrates that Black suspect / White police officer interactions are particularly fraught. If a White police officer is called into a Black neighborhood, there is a much higher chance that the officer is going to use force. For example, if the neighborhood is more than 90% Black, police may be more than 4x likely to use force as if they got called to a neighborhood that was only 10% Black. Meanwhile, Black officers in Black neighborhoods are hardly likely to use force, or even in non-Black neighborhoods. 67% of police officers are White, a statistic that roughly tracks the overall US population, which is 61% White. 

Police shoot and kill Americans much more often in March

Interactive data viz

📅 March is the deadliest month for police violence in America by far. 105 Americans are killed in March on average (highest month) compared to September when 72 Americans are killed on averaged (lowest month). It is unclear why March is so deadly. Police violence/crime researchers generally point to the “summer crime wave” in which crime increases during the summer months. But March doesn’t fall in this bucket. If you have an idea about why this might be the case, I’d be grateful if you replied in the comments.

Leave a comment

The Path Forward

George Floyd was killed on May 25th, 2020. Derek Chauvin held his knee on George Floyd’s neck for 9 minutes and 29 seconds. 9 months later, Democratic leaders introduced the George Floyd Justice in Policing Act, which passed the House of Representatives in a largely party-line vote and failed in the Senate in September 2021. The bill outlines some of the best paths forward for reducing police violence in America. 

  • 🔫 Limit the use of deadly force - US law states that deadly force is only allowed if an officer believes there is “imminent” threat to the officer or if the suspect is fleeing and may harm the community. This means that deadly force can be the first option that an officer turns to. Police should have to exhaust all other forms of apprehension. Colorado, Sacramento, and New York City have also increased their standards for the use of deadly force and 5 states have created rules limiting the deadly actions that police can  take when a suspect is fleeing. This has shown to increase accountability and reduce police killings by increasing the threshold for which force can be used. 

  • 🏛 Restrict qualified immunity - Qualified immunity shields police from personal accountability for wrongs committed on the job. When the Supreme Court created this statute in 1967, it largely helped police stop the Ku Klux Klan. But it has now taken on new force to allow individuals to be protected under a police system. Colorado, Connecticut, New Mexico, and New York City have all ended or restricted qualified immunity, thereby forcing cops to recognize the role they play as individuals in ending the life of other individuals. Last year, a federal appeals court found that a police officer who shot a 10-year-old by mistake while aiming for the family’s dog was protected from liability under qualified immunity.

NYPD practice operations with their newly acquired armored vehicles from the 1033 program. Police with this gear kill more people each year. Image source - DoD
  • 🪖 Demilitarize the police - Researchers have found that the more military gear a police department has, the more that those police officers kill Americans. The Federal 1033 program allows the Department of Defense to give state, local, and federal law enforcement agencies military hardware like grenade launchers, bayonets and mine-resistant ambush-protected vehicles (MRAPS). Police departments with no 1033 requisitions could expect 0.287 killings of suspects, on average per year, while those with the max expenditure could expect 0.656 killings, more than twice as many. The researchers even found a similar increase in police killings of dogs, suggesting that cops weren't necessarily gearing up for big, casualty-heavy raids with their requisitions. They were simply becoming more violent in general.

Philando Castile was shot and killed by police at a traffic stop outside of St. Paul. He was 32. Image source: BlackPast

The table below has the names of every person whom police shot and killed over the last 7 years. You’ll find Breonna Taylor (age 26), Philando Castile (age 32), and Alton Sterling (age 37) amongst others. One of the most critical parts of this work for me is to remember that there are very real people behind all of this very real data. It is the reason I make sure that there is a story and a person in every article. Showing names in a table doesn’t do justice to their lives, but I hope that it helps us remember the fragility of our communities and reinforces the belief that we can do better.

Search +7,500 names

1
Share this post
Police killings and Inequality
americaninequality.substack.com
1 Comment

Create your profile

0 subscriptions will be displayed on your profile (edit)

Skip for now

Only paid subscribers can comment on this post

Already a paid subscriber? Sign in

Check your email

For your security, we need to re-authenticate you.

Click the link we sent to , or click here to sign in.

Seth Harper
Jun 22Liked by Jeremy Ney

No data to back this up, but my guess is that March is so deadly as it’s when Americans are re-emerging from winter. When everyone is inside and it’s cold, I hypothesize that cops are less likely to engage (do we see low rates Dec-Feb?). As March rolls around more activity is outside, cops may be more likely to engage and are ready to use force again (almost like they haven’t had opportunities for the winter and are releasing). As for September, my guess is that it’s related to back to school. During the summer, kids out may be school children. Once kids go back to school, police may be more comfortable assuming anyone young and out is a criminal since they aren’t in school, so they feel more comfortable using force. Again no data to back up these hypotheses, but it’s what popped in my head.

Expand full comment
ReplyGive giftCollapse
TopNewCommunity

No posts

Ready for more?

© 2022 Jeremy Ney
Privacy ∙ Terms ∙ Collection notice
Publish on Substack Get the app
Substack is the home for great writing