The $122 Billion Disappearing Act: How US Schools Face a Looming Crisis
Critical programs are at risk as students and teachers brace for a fallout in school funding
INTERESTING ON THE WEB
I was featured in this Newsweek article about the shrinking middle class and challenges for manufacturing workers - Newsweek
The UK raised the minimum wage in April. How much is inequality costing the country? - The Guardian
Income inequality is greater among Chinese Americans than any other Asian origin group in the US - Pew
NYC MTA publishes first ever dataset on where NYC riders are going and where they get off (if you swipe in at Chambers at 9am and then swipe in at Grand Central at 6pm, they guess that is where you got off) - MTA
$122 billion in federal funds that was meant to help schools recover from the pandemic is going to disappear in September. This means schools will be forced to cut tutoring, after school programs, and basic supplies at a time when many schools have still not bounced back
Kids know when schools, teachers, parents, and systems are not investing in them. In Idaho, which has the lowest school spending per pupil of any state in the US, students talk about how they feel embarrassed to be in rooms with leaky ceilings where tiles can fall down at any moment. They know which wall outlets not to use because the electricity doesn’t work on that wall, and which days they need to bring extra layers because there’s no heat in a particular classroom. Students act like nothing happened because they are so used to it.

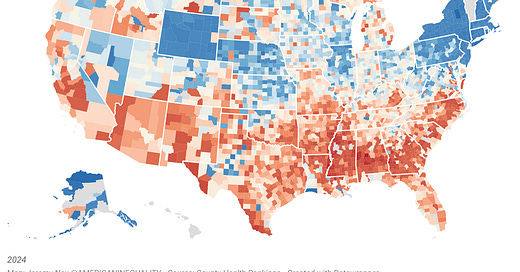
This dataset looks at the average gap in dollars between actual and required spending per pupil among public school districts. Required spending is an estimate of dollars needed to achieve US average test scores in each district.
Schools are losing money due to budget cuts and lower enrollment
US public schools lost more than 1 million students between 2019 and 2022. This occurred as parents began homeschooling kids more during the pandemic; as school choice increased; and birthrates decreased over several years.
The Minneapolis Public School District saw a 17% decline in student enrollment from 2019 to 2025. The school has capacity for 40,000 students but only 23,000 students were enrolled in 2024. The city auditor explained that one fifth of the enrollment loss was due to charter schools or open enrollment. The Minneapolis Public School District received $262 million in federal pandemic funding over the last 3 years, but knows that this will disappear in September. In 2022, only 33% of students met the standards for math and 42% met the standards for reading.
New York spends the most per student, so why aren’t students there doing better?
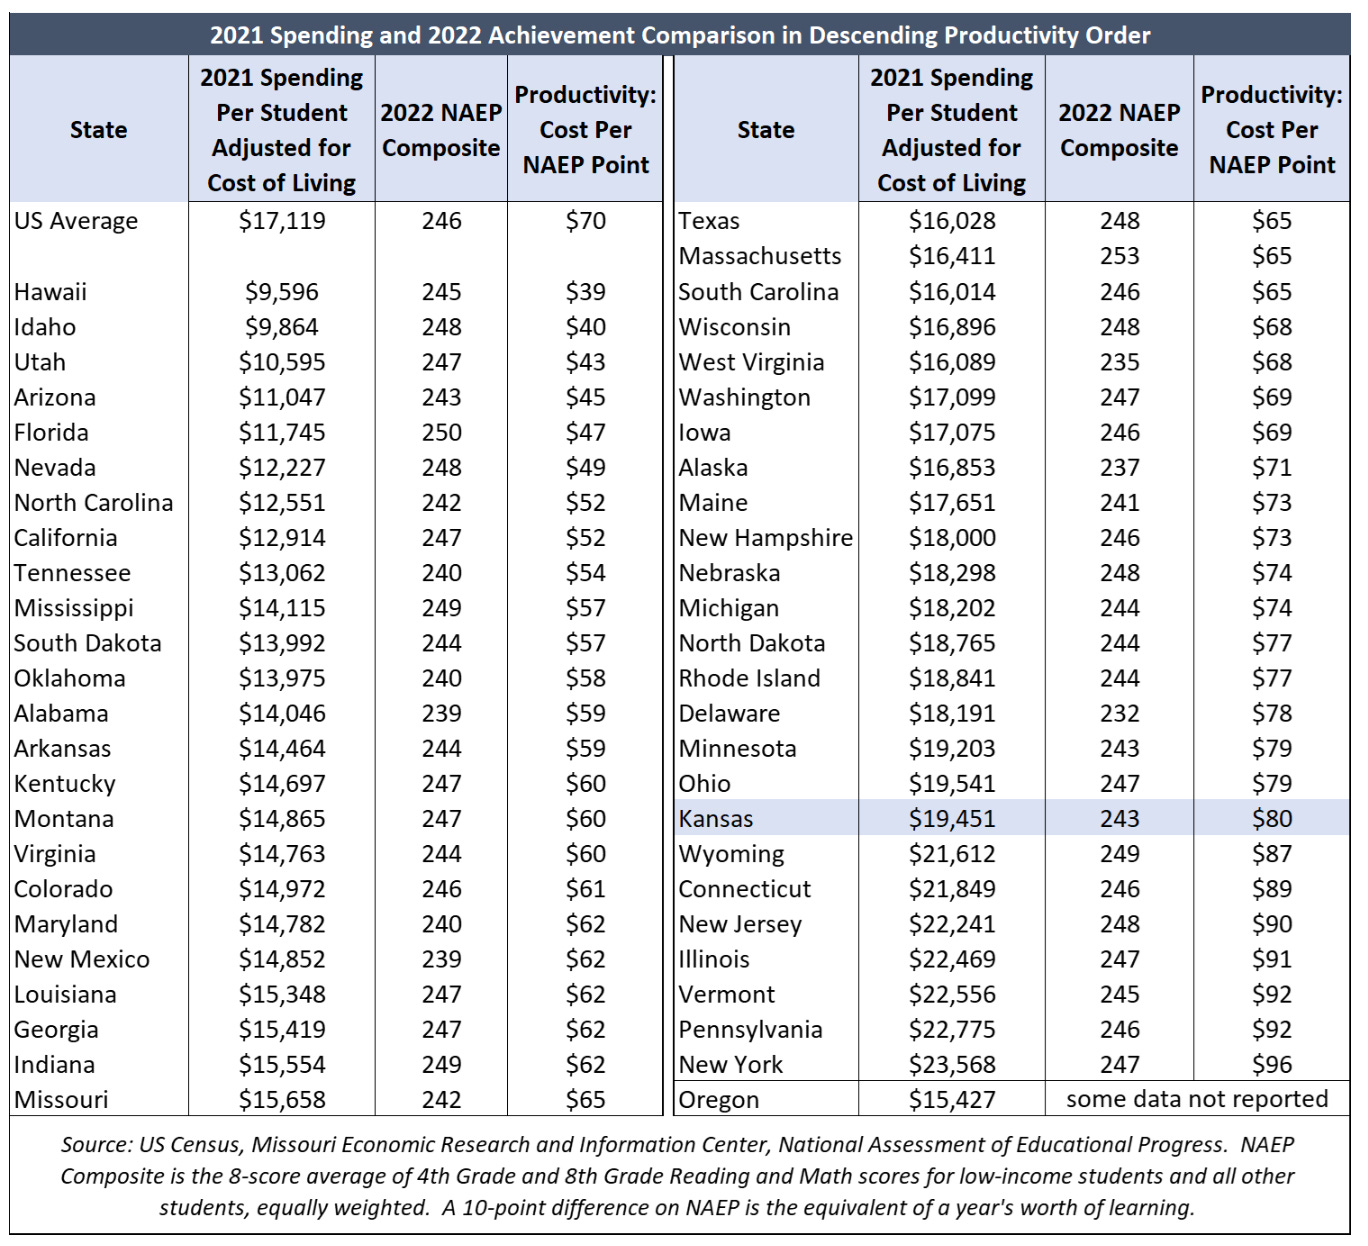
The average spending per pupil for the nation’s 50 million students enrolled in public schools is $15,633. Places like (New York ($29,873), the District of Columbia ($27,425), and New Jersey ($25,099) are nearly double those numbers while Utah ($9,552), Idaho ($9,670), and Arizona ($10,315) bring those values down. Typically 80% of a school’s budget will go towards salaries and benefits for teachers.
However, these state-wide averages do not make any statements about how much is needed for students to achieve sufficient reading and math scores. In the map above, Quitman County in Georgia right along the border with Alabama has a per pupil shortfall of $63,406. This is because student test scores remain far below state and national averages.
New York leads the nation in spending per pupil, but does not lead the nation in testing scores. New York is in the middle of the pack when it comes to reading and math scores, which goes against the conventional understanding that more investment typically equates to better performance. Nearly every district in the state is spending enough to get adequate test scores, but this isn’t the observed result. While some argue that these studies don’t take into account extracurriculars that the state sponsors, the general consensus seems to be that New York is paying more for less.
Does Idaho have the best return on investment? Not quite…
Idaho, on the other hand, has the best spending per dollar test score. The National Assessment of Educational Progress – often called “The Nation’s Report Card” and the gold standard of comparing educational attainment across states - shows that Idaho spends $39 per NAEP point. How does Idaho spend 42% less than the national average and still achieve high scores?
Funding with additional sources: It appears that many of the local districts are actually supplementing their budgets with bonds and additional taxes that aren’t well captured in the national or state level data. Parents in low-income neighborhoods don’t like this approach because with fewer businesses and lower property values in the region, they gain less from additional taxes, whereas overarching state policies could control for these differences better.
Inequitable spending: Wealthier districts get far more funding, which boosts the overall state performance. These students performing far above the average helps bring up the overall score for lower-income districts that tend to perform worse.
Chicago, on the other hand, had one of the best performing school districts pre-pandemic when accounting for its funding per pupil. The school uses an International Baccalaureate curriculum. The students read the Junior Great Books. The school hosts a community farmer’s market. The mayor has pushed for longer school days and expanded pre-K. The high performance there has happened even with declining enrollment, low budgets, and 75% of children coming from low-income homes. From 3rd to 8th grade, students saw the equivalent of 6 years of grade improvement, not just 5.
Vouchers are not the answer
Other states like Arizona (3rd lowest spending per pupil) have helped keep budgets down through state-funded voucher programs. In 2022, Arizona pioneered the largest school voucher program in the history of education. As ProPublic explains, “Under a new law, any parent in the state, no matter how affluent, could get a taxpayer-funded voucher worth up to tens of thousands of dollars to spend on private school tuition, extracurricular programs or homeschooling supplies… Yet in a lesson for these other states, Arizona’s voucher experiment has since precipitated a budget meltdown.”
Arizona now faces a $1.4 billion budget shortfall, much of which was a result of the new voucher spending.” Arizona is now having to make cuts to other state programs like one to assist in water scarcity, another meant to expand highways, a project to rollout air conditioning in more prisons, and cuts to community colleges.
The Path Forward
Public school K-12 budgets come from 3 different funding sources: state, local, and federal. State and local funding make up roughly 90% of school funding, so these are the most important buckets to target to ensure that students.
Create ‘change-points’ to open up more state funding: Studies from Ohio, Michigan, California, Texas, and Massachusetts have all found that boosting funding improves test scores. Kentucky is the only state that has not found compelling evidence in 2003. While the funding in New York is perplexing, it is hard to know the counterfactual - how much worse would students perform without that funding? Studies generally show that a 2-3% increase in school budgets decrease high school drop-out rates by 0.5-0.8%. In this case, more money tends to improve outcomes. State funding used to make up just 18% of education funding in 1920. It now makes up 45%. Legislation is often needed to make this change, and New Hampshire and Michigan show how a deep review of how states spend their money can open up new ‘change-points’ for a meaningful increase in school spending.

Equalization for property tax funding across districts: The US is one of only three OECD nations that does not provide more resources to disadvantaged schools (the other two are Turkey and Israel). This is because the other largest share of funding for public schools comes from property taxes - wealthy communities, with higher property values, tend to have better schools because they get more funding. This can amount to a gap of an additional $17,000 per student per year. Equalization is the process by which states can move funds around across districts to ensure that lower-income neighborhoods with lower property values get the support they need. Studies have found that the best way to implement equalization is to take small amounts from many districts that are better off instead of one large lump sum from the wealthiest district. However, some states like Texas obfuscate this approach, so it is important to learn from them about how to promote better transparency.
With the new school year upon us, students are about to walk into classrooms that remain sadly underfunded. Bookshelves will remain bare, bathroom stalls will remain broken, cafeterias will not have enough chairs. Communities improve when all students do better, not just some. With the start of the school year rapidly approaching and election season coming up, identify what your local leaders are doing to make sure that your child and their friends are getting the very best.


