

Reflecting on 5 years of American Inequality
A big thank you and what the next 5 years have in store

I’ve been writing American Inequality for 5 years now and it has offered some incredibly eye-opening moments that I want to share with you all. I use data to write about inequality and to highlight regional divides, but every article also includes stories of individuals struggling with issues of poverty, homelessness, unemployment, incarceration, and chronic health conditions. I think people often forget that there are very real people behind these very real numbers and so I do my best to blend the worlds together.
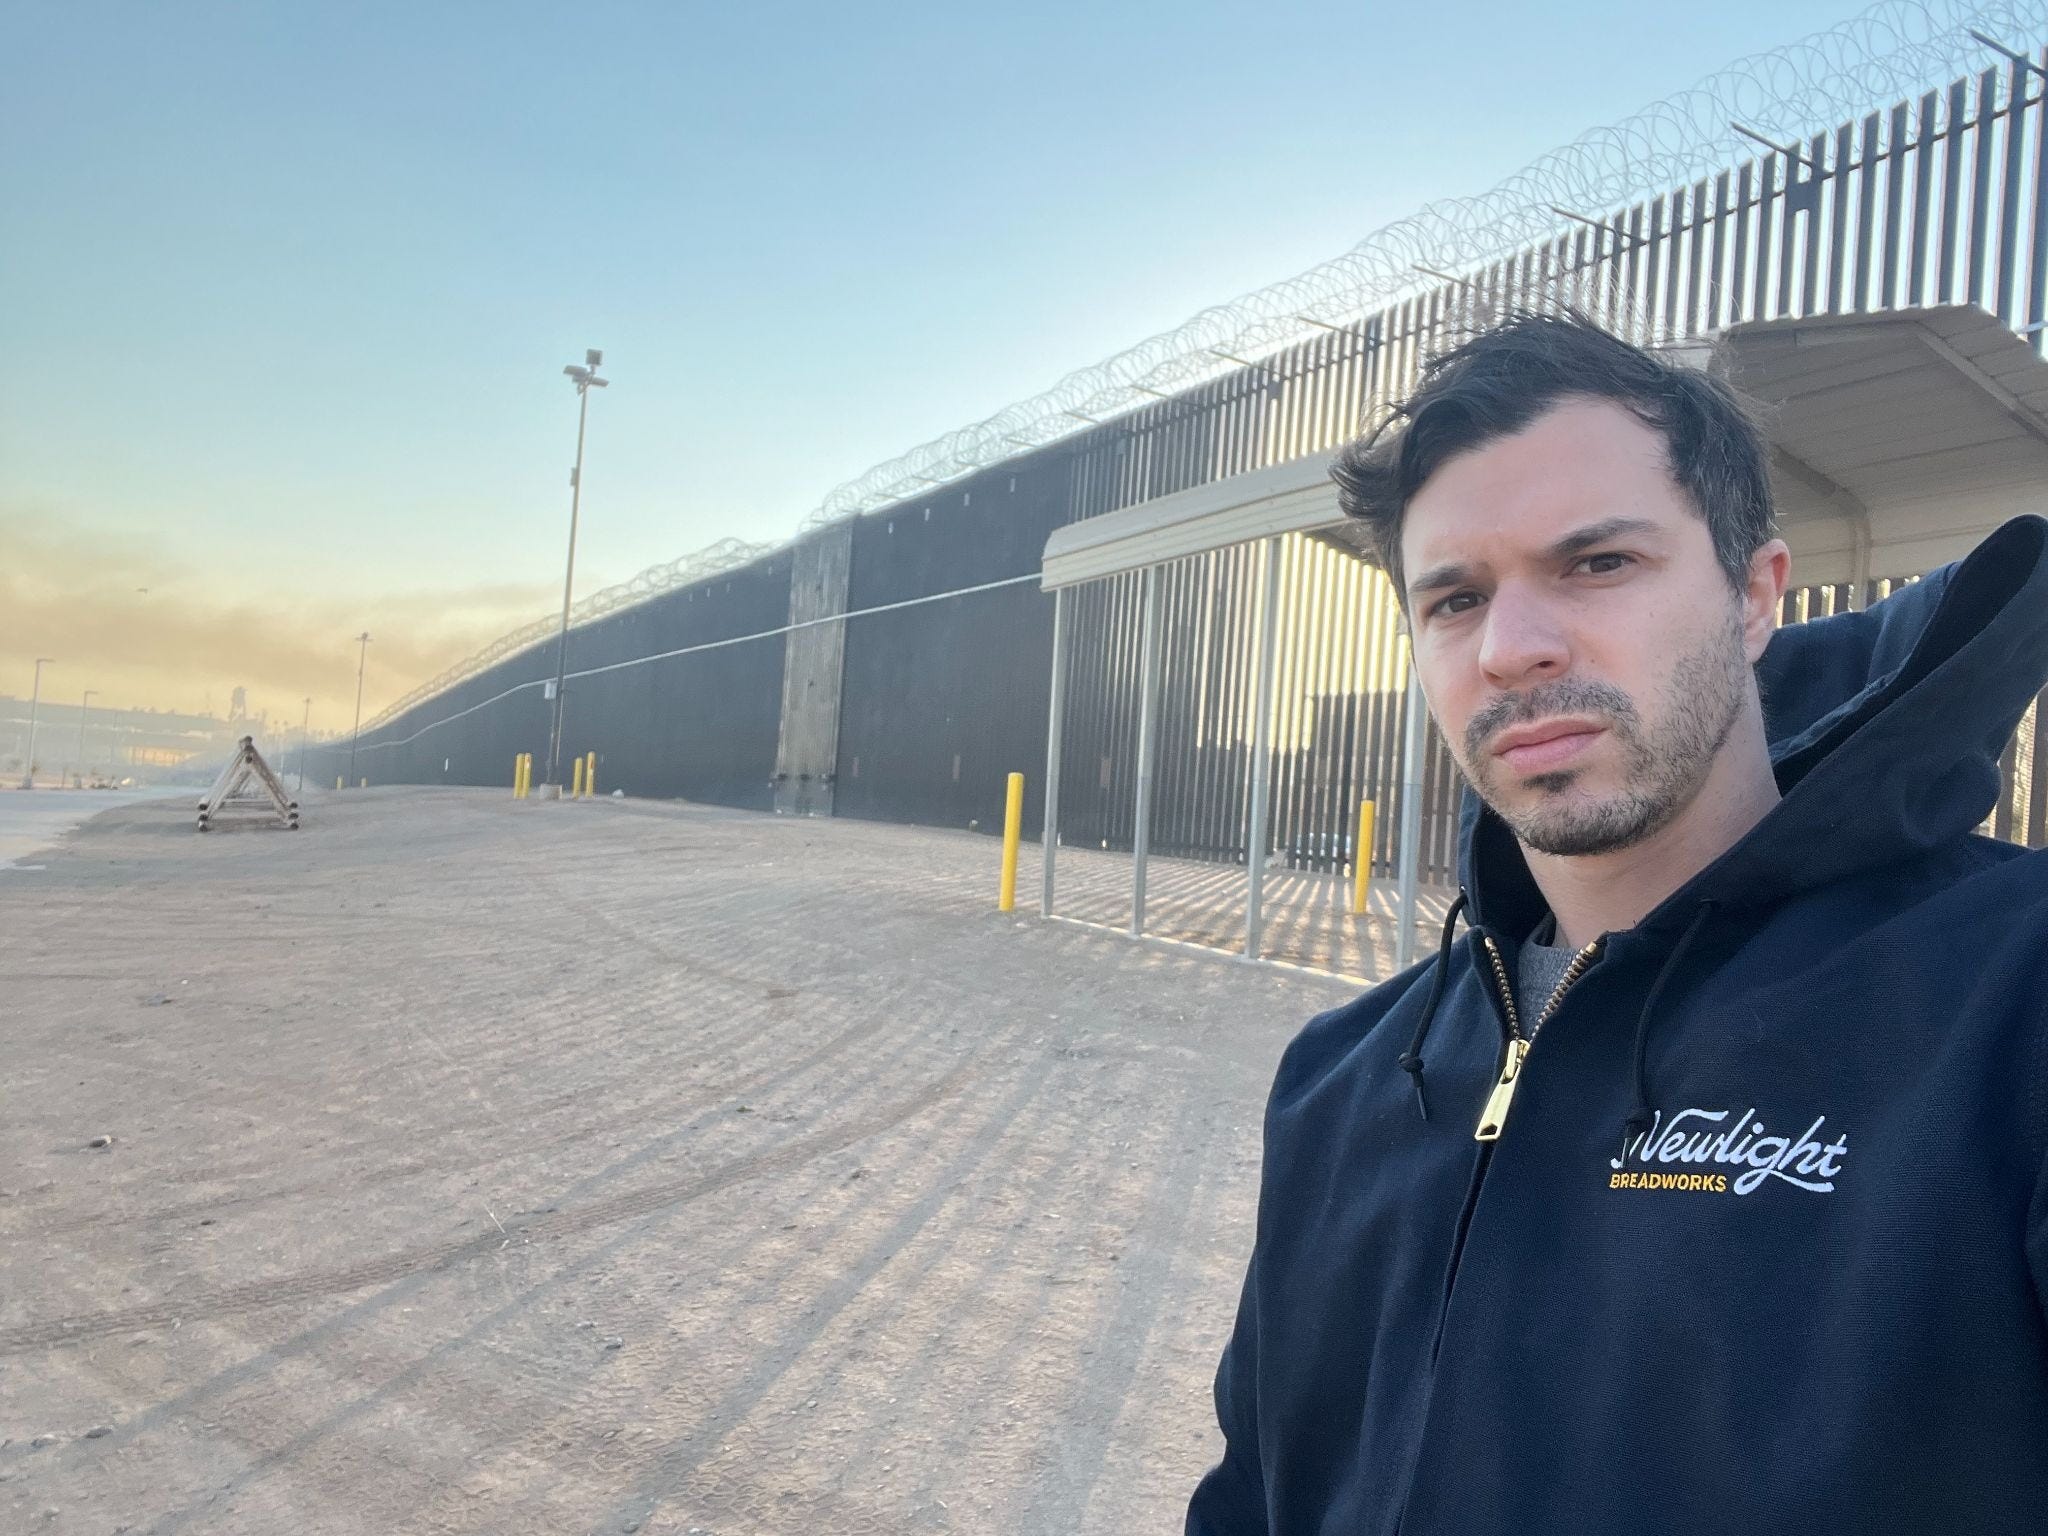
Over the last year-and-a-half as I’ve been working on my book (which emerged from this newsletter), I descended into coal mines to talk with workers in West Virginia who lost their jobs to globalization and their children to opioids. I met with preschool teachers in the county in South Dakota with the lowest life expectancy in the US - from the article that started everything - to hear about how they try to inspire hope for children. I met with pastors in Mississippi in the county with the lowest incomes in America about how affordability hits so differently for them than anywhere else in America. This is the whole reason I do this work. Their stories move me to find solutions that leave the country a bit better than we found it.
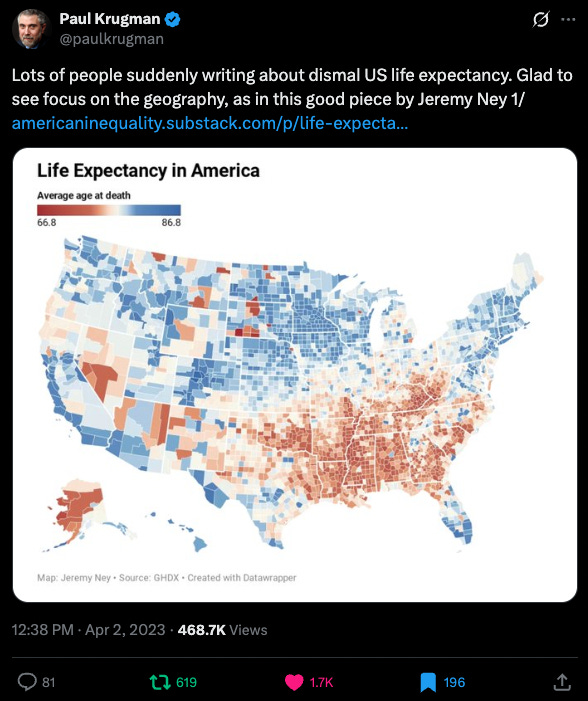
I decided to look back on what has changed in these last 5 years. My first newsletter was about life expectancy and inequality and how the US was experiencing the greatest divide in life expectancies across regions. If you happened to be born in certain parts of South Dakota or West Virginia, you would die at 67 on average. But if you were born in parts of Colorado or Virginia you would live 20 years longer. That article would sit for about 2 years before people came to see just how shocking it was. Paul Krugman was one of those people who helped highlight that divide and things largely took off from there.
The very process of writing all of these newsletters has also helped me see America through a very different lens. I began my career working in the federal government. This Substack largely emerged from some projects I was kicking around while at the Federal Reserve. I have long believed in the power of the federal government to drive great change, but I’ve also come to see the incredible power of local governments for acting as engines of opportunity. Local preschools that set children on a new path. A mayor’s plan for public safety that brings businesses back to the community. Moreover, I’ve similarly come to see the strength of the private sector for activating prosperity when political gridlock and polarization become too entrenched. An apprenticeship program run by a local manufacturer that gives high school students a leg up. A rural doctor training program that improves the healthcare of some of the country’s hardest to reach areas. Inequality emerges in communities, but it is also where change begins.
The newsletter has also helped me meet with so many amazing organizations and individuals who are pushing the boundaries of ingenuity for addressing inequality. For the Substack, I’ve interviewed former Congress members, best-selling authors, and Nobel Prize winners. I’ve interviewed high school teachers, formerly homeless people, and nonprofit leaders. I’ve had the chance to give a TEDx talk, to publish works in TIME Magazine, to get interviewed for the Los Angeles Times, Washington Post, and NPR. I’ve shared my data with leading universities and rural preschools. I’ve had public debates with people who believe inequality is a myth and I’ve picked vegetables with farmers who have only ever known a minimum wage. I’ve had 12 people be part of the team over these last 5 years creating tools, partnerships, events, and paid-projects. On a flight home to New York City after a work trip, I sat next to an old woman who just happened to be reading one of my articles and we’ve stayed close since then.
Over these last 5 years, the state of inequality in America has been a mixed bag. Affordability was hardly part of the national dialogue and the housing supply was constrained because of a pandemic, not because of red tape or immigration. The AI boom was still 2 years away, which would threaten job prospects for recent graduates and raise concerns for unemployment, and big tech was still hiring like crazy. In 2021, emergency policies made government feel capable again, but now skepticism dominates and corruption and capture have sunk in. Stock markets were roaring in 2021, but the distributional effects hadn’t fully calcified. Today, it feels like wealth gaps are locked in by who owned assets during the surge and who didn’t.
As meaningful as this work is for me, I won’t deny that writing about these topics is incredibly challenging. It is painful to see the level of poverty that this country continues allows, how we can see these inequalities as clear as day in the data, and yet week after week goes by when policymakers and our nation’s leaders do little to alleviate this suffering.
It is also really challenging to publish this work on the internet because the internet is a totally crazy place. I think most people would be shocked about the amount of hate mail I get. Every newsletter I send out I always get responses with personal attacks, hateful comments, and derogatory messages telling me that I need to stop writing because not all humans are born equal, that immigrants don’t belong in this country and I should stop trying to defend them, that people are poor because they don’t try hard enough and I need to stop my propaganda. I used to take screenshots of all of these and keep them in a folder called ‘Haters’ on my laptop, but eventually I stopped.
But I really do believe that data is a powerful entry point into these hard conversations. It allows us to put a number out in the world (or a map or a chart) and all gather around it and say - what do you see? In all 5 years of this work I always present the data exactly as it appears from the FBI, CDC, EPA, HUD, BLS, or any other letter-combination-of-agencies that publish data. Although the fidelity of our U.S. statistical system is waning, I really believe there is something about the combination of data, stories, visualizations, and solutions - grounded in science - that allow us to have a substantive argument about what type of America we want to have.
This is the only America that we’ve got. It is far from perfect, but you can be sure that I’ll be spending the next 5 years (and beyond) doing my part to make our communities a bit stronger, smarter, and better prepared for an uncertain road ahead.
I’m grateful for how many of you believe in this work too and for that I want to say a deep and humble thank you. I take the responsibility very seriously that you’ve chosen to spend some of your time here reading, thinking, questioning, pushing back, and pushing forward. It really means so much to me, especially in those moments when it can feel like poverty is defeating prosperity.
But perhaps the most important thing I’ve come to realize is that this newsletter has never been just mine: it is a collective endeavor. The stories, screenshots, datasets, articles, and maps that you send me have shaped this work beyond compare. I know that so many of you can see your fingerprints and fragments of ideas on the hundreds of articles and posts over the last 5 years. That group effort is really astounding and what makes this work so powerful.
If we’re going to build a country that offers real opportunity, not just rhetoric or words written on an old piece of paper, it will take a lot of people who care enough to stay in the conversation. So, thank you for staying. Thank you for believing that better is possible. I’m honored to be on this road with you and I’m thrilled for your help in sharing this message with others who want to go down that road too. Here is to a better path forward together.
I’d be incredibly grateful if you shared this newsletter with 3 friends. Thank you for your help in addressing U.S. inequality and working together to find solutions for a brighter tomorrow.
Thanks for your critically important work. Inequality is, & has been, one of the defining characteristics of US culture. A shame under any circumstances, but especially because it's not hard to do better.
Stay at 'em!
I hope more people learn to use maps to show where people need more help, and why, along with what help is available in some places, but not to all places. Or for a few years, but not long enough.
More people need to learn to use their voice, to create blog articles, videos and social media posts that point to information that you and others share, and point volunteers, donors, business and others to organizations serving distressed populations. Helping existing programs constantly improve, and helping new programs fill voids in underserved areas, can be supported by maps like you share.