Why I use data to evaluate inequality
Seeing is believe
I’m doing something a bit different with this article - taking a bit of a birds eye view on why I build all of the data visualizations and maps for each article. My goal is to helps others see how the bare facts behind an issue in a way that starts a deeper conversation. But first…
AMERICAN INEQUALITY IN THE NEWS
I was interviewed in Politico about America’s life expectancy divide - Link
I had a segment on NBC talking about the high costs of childcare and the undue burden that it puts on parents in certain states - Link
I went on the Healthy Intersections podcast to talk about the mental health and incarceration inequality that arises from the opioid epidemic - Link
IDEAS FROM AROUND THE WEB
Big farms and flawless french fries are gulping water in the land of 10,000 lakes (I’d bet this wins a Pulitzer) - Link
FASCINATING analysis about how bombs seemingly randomly dropped in London during the Blitz led to higher housing density in those areas - Link
The poverty rate rose to 12.4% in 2022 from 7.8% in 2021, the largest one-year jump on record - Link
Terrific storytelling on how childcare costs are crushing New Yorkers - Link
Investors, policymakers, and businesses are all increasingly looking to measure their impact on the world. As researchers from The Rockefeller Foundation put it, “Accountable to taxpayers, funders, and a diligent global community, these organizations have long felt the pressure for demonstrating tangible results.” However, as the amount of funding has dramatically increased in the social impact space, the result has produced “a lot of bad deals done by good people.”
Data has become a powerful tool for making sure that resources can be effectively channeled to communities most in need. Change-makers can use data to identify how a critical social challenge is preventing a community from opportunity. Nevertheless, with this abundance of data, raw data is no longer enough. Analysis is the key is for new leaders to be able to use data visualization that sheds light on growing problems. Only in this way can private, public, and non-profit sectors drive meaningful change.
A picture is worth a thousand words
Humans struggle to understand patterns from numbers in a table. Our brains tend to see these numbers as words rather than as insights or as a story, which is what they actually represent. When data is visualized in a graphic, however, our brains are able to see patterns and understand much more information.
Edward Tufte’s famous example of coding information proves this point. In the table below, our brains are unable to draw any meaningful insights. But when we visualize these datapoints, Tufte points out that the “Graphics reveal data. Indeed graphics can be more precise and revealing than conventional statistical computations.”

Data visualization drives decision making
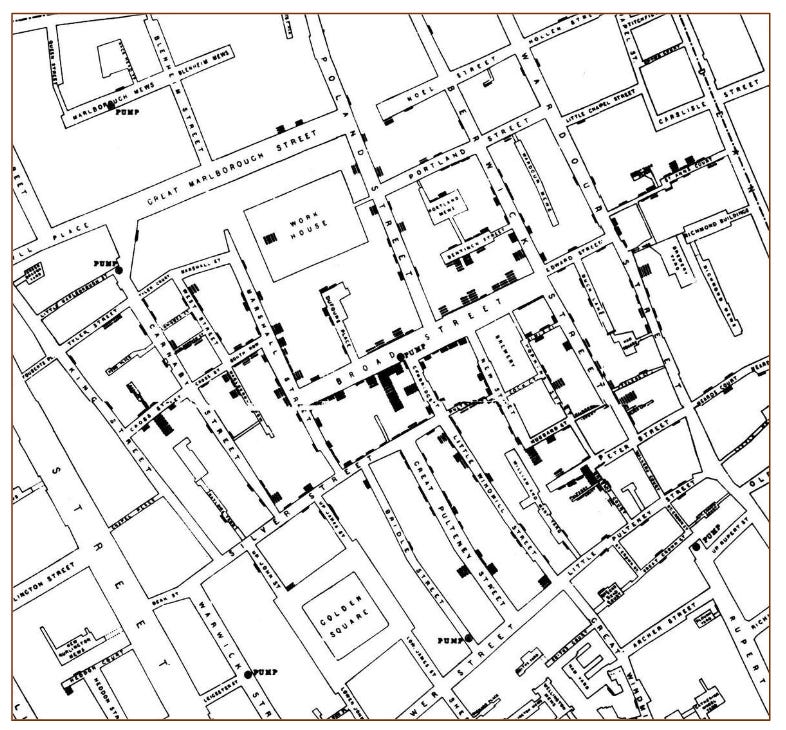
The value of data visualization for decision making proved how valuable it can be more than a century and a half ago. In 1854, the John Snow built a Cholera map using small bar charts on streets in London to indicate where outbreaks of Cholera were appearing in the city’s center. Public health officials had been trying to understand what was causing the outbreak and previously had been unable to understand this, until John, the clever data visualizer he was, created the image below.

The visualization helped the city realize that the households that suffered the most from cholera were all using the same well for drinking water. This was a revelation at the time.
The City of London spent years thereafter investing in better sewage systems to prevent well contamination. The visualization is thus so powerful because it not only revealed the nucleus of an issue, it also helped drive forward a solution that would benefit communities for decades to come.
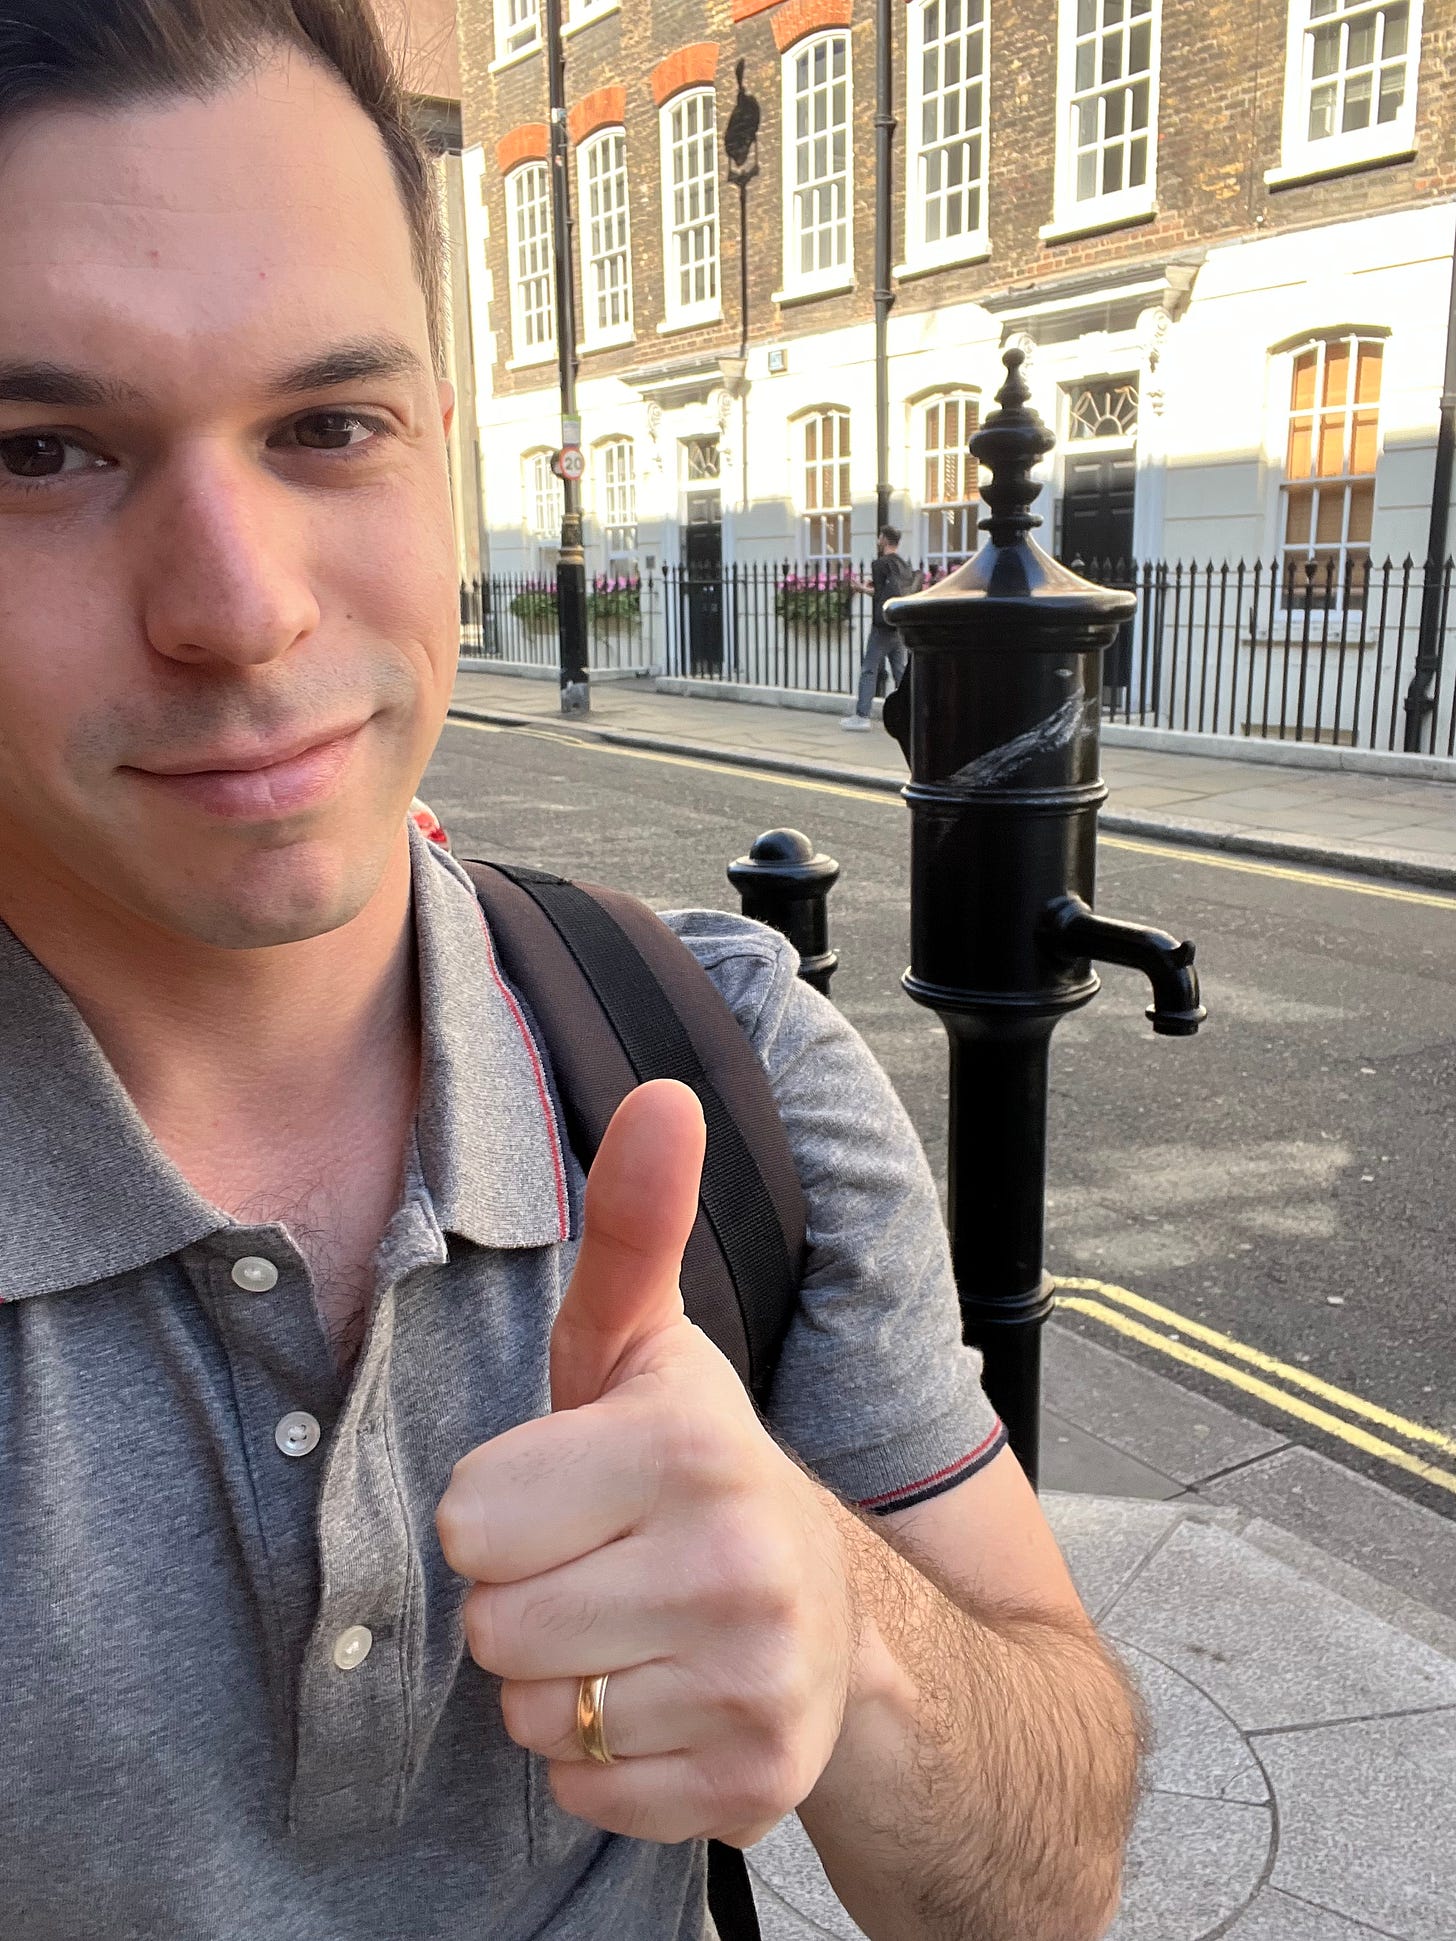
I was so excited about this John Snow data visualization that when I was spending this past month in London I went to visit the very water pump on Broad Street that now commemorates this change. If you look in the map above, this water pump is located right where that biggest bar is on the corner of Broad and Lexington in London’s Soho.
Internet access during the COVID-19 pandemic
When the COVID-19 pandemic pushed students online and caused employees to work remotely, the disparities in internet access became quickly apparent. According to the FCC, 21 million Americans and 10 million school-age children did not have internet access, and some researchers estimated that these numbers might be twice as high.
America knew qualitatively that it had an internet access issue, but it didn’t always know quantitatively where those communities were.
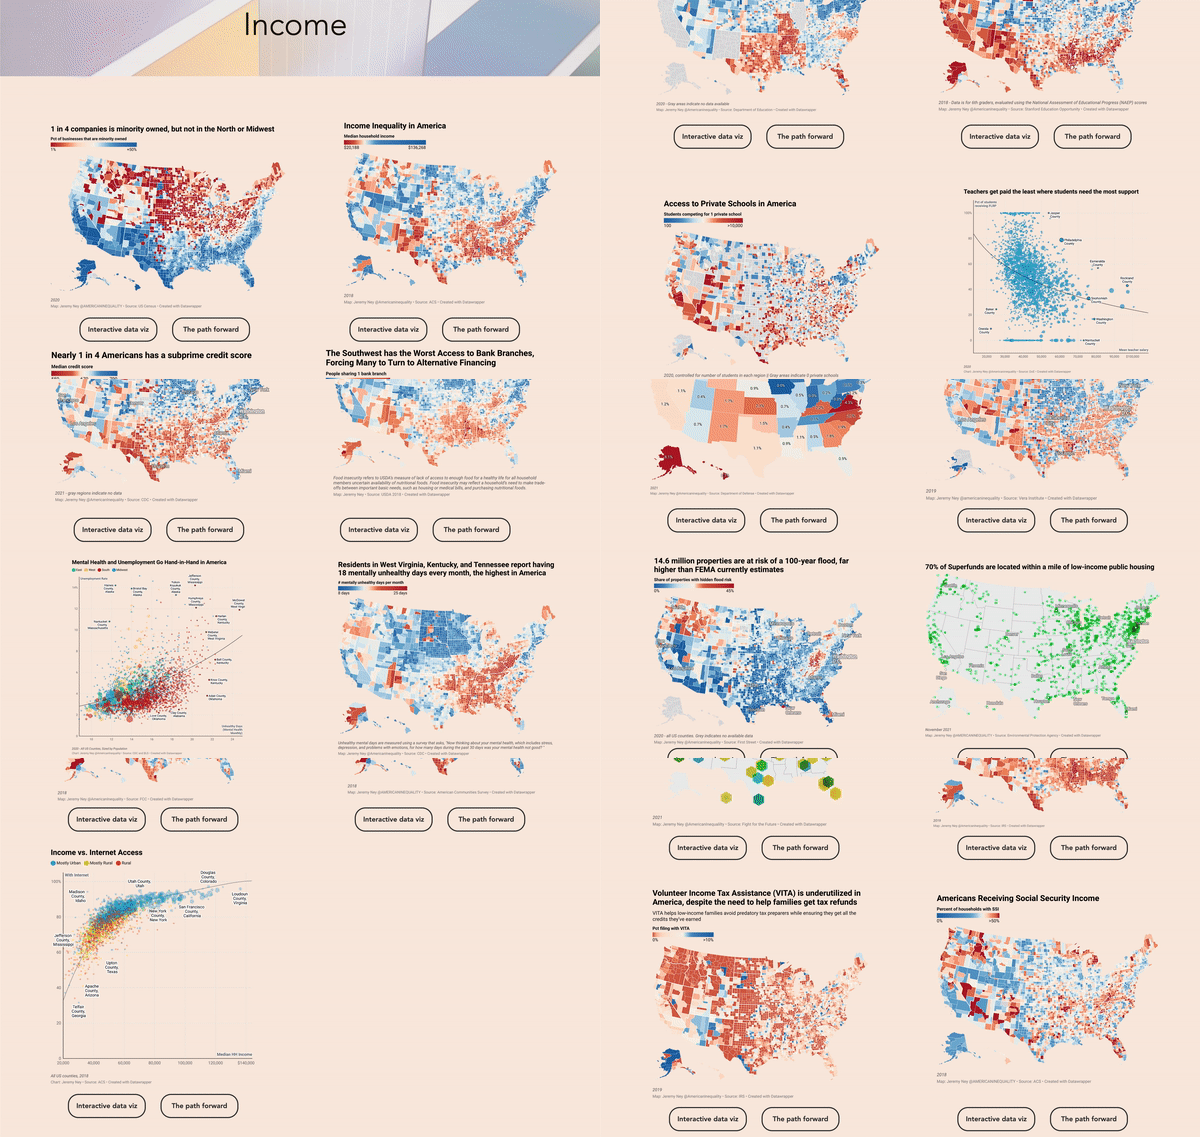
At American Inequality, we published several pieces visualizing internet access and inequality in the U.S. to address this issue. We used our geospatial mapping to highlight areas that were struggling with the digital divide. We then partnered with a non-profit called No One Left Offline to distribute wi-fi hotspots across Oregon that had low internet access and needed support. The team heard testimonials from families sharing that, “I wouldn't have been able to connect to the internet without this support from NOLO.”
As the Biden Administration’s is deploying $65B through the new Infrastructure Bill to provide high-speed internet to communities, they have explained that they plan to rely on maps like these to make data-driven decisions about where to allocate their funding.
Data visualization can and has driven real change. This isn’t happening just centuries ago in London, but instead it is happening everyday in policy meetings and in board rooms.
Opportunity Mapping for better solutions
Every graph is a comparison. Geospatial graphs in particular highlight comparisons across regions. This allows decision makers to understand where to direct their efforts.
When we see a map like the one above, our eyes may flash towards the regions in red. These are the regions that are particularly struggling with a challenge. However, businesses and policymakers should also look to the regions in blue to learn from what may be working well. I call this practice is called “Opportunity Mapping.”
State governments have been using this data practice for years, and it’s time to bring it to communities. Research has shown that as states increasingly struggle with the effects of climate change, state government officials are turning to other states that have been navigating these challenges for years. For example, after Hurricane Sandy New Jersey urban planners engaged researchers and local policymakers from Hawaii so that they could learn from Hawaiians and understand new approaches for navigating rising tides. We’ve seen this same type of cross-area-learning happen for tobacco controls, same-sex marriage legalization, and renewable energy standards.
Deeper data on counties instead of states can make it easier to tailor proposals for communities. This allows researchers and activists to build data visualizations with purpose in mind.
Analytics for impact
Data visualization is a powerful tool for making a difference. It can help change-makers understand where to direct their efforts amidst a sea of information on complex topics.
As leaders in the private, public, and nonprofit sectors continue to use data visualizations to make decisions, the key will be to observe both what is not working as well as what is working well. Cholera maps were able to show public health officials where the issues were, but they also needed to understand where the solutions existed to maintain clear water supplies.
I include a path forward in every article to suggest some of the ways that we can learn from data visualizations to improve the lives of many. The U.S. is battling against a tide of injustice in housing, healthcare, education, taxes, racism, sexism - and location turns out to be a huge driver of these disparities. Data visualization can shed light on these issues, but most importantly, it can help drive meaningful change.
If you found this helpful, leave a comment below on where data helped you see an issue in a new way or where you wish there were more data/data-viz on a problem.


I've been a fan of using maps since I learned about their potential in 1993 while trying to show where non-school tutor/mentor programs were located in Chicago and where more were needed. I've built a library with links to data visualizations such as yours. We need more people looking at this information.
What I have not yet seen is mapping of resources being distributed, down to the neighborhood level. Massive levels of funds from philanthropy, government, business and private donors have been generated annually to fight poverty, yet as some of your maps show, there still are many areas that don't seem to have been reached. Or reached consistently for many years.
Are you (or anyone else) doing any visualizations showing funding flows?
Here's a page showing six sub sections of my library. Two are focused on GIS maps and visualization. https://tutormentorexchange.net/resource-links/collaboration-process-improvement
And here's a page on my website where I focus on "distribution" of needed youth programs and resources. https://tutormentorexchange.net/mapping-the-programs
I embed maps and visualizations in my http://tutormentor.blogspot.com blog and focus on uses of maps in the http://mappingforjustice.blogspot.com site. Both of these blogs date back to 2008 and earlier.
And here's a concept map where I point to many data mapping platforms. http://tinyurl.com/TMI-MappingData
I'll check out the site you sent. However, what I like about your work is that you're using data maps in stories and offering solutions. I don't see enough of this on other platforms, and I don't see a consistent effort to teach others to embed data maps in on-going stories. Doing so would increase the number of people looking at this information and the frequency in which they see it.